K8s Provisioning on AWS with Kubespray
Stand up a cluster with kubespray in AWS with minimal knowledge of AWS, Terraform or Ansible. First, we'll provision infrastructure in AWS with Terraform. Next we'll set up Bastion and provision a K8s cluster with Ansible. To confirm success, we'll then run kubectl commands to verify things are healthy, then clean up by deleting the cluster.
November 21, 2019
K8s Provisioning on AWS with Kubespray
November 21, 2019
This goes through standing up a cluster with kubespray in AWS with minimal knowledge on aws, terraform, or ansible.
(0) provision infrastructure in AWS with terraform
create a t2.medium EC2 Ubuntu 16.04 instance in default VPC of us-east-2 (regardless of default VPC or not, ensure it's in a subnet that's accessible via your aws setup)
- ensure you grant it a pem key (be sure to save it and chmod 400 on it!)
Once ssh'd into machine (let's call it the terraform machine):
$ apt-get update
$ apt-get install awscli -y
$ apt-get install unzip -y
$ wget https://releases.hashicorp.com/terraform/0.12.2/terraform_0.12.2_linux_amd64.zip
$ unzip terraform_0.12.2_linux_amd64.zip
$ mv terraform /usr/local/bin/
$ git clone https://github.com/kubernetes-sigs/kubespray.git
#update the distro to be Ubuntu in variables.tf
#NOTE: see the instructions in kubespray/contrib/terraform/aws/README.md:
- Ubuntu 16.04, replace 'data "aws_ami" "distro"' in variables.tf with
data "aws_ami" "distro" {

most_recent = true


  filter {

    name   = "name"

    values = ["ubuntu/images/hvm-ssd/ubuntu-xenial-16.04-amd64-*"]

  }


  filter {

    name   = "virtualization-type"

    values = ["hvm"]

  }


  owners = ["099720109477"]

}
from instructions, update the credentials.tfvars
Be sure the .pem is excluded from the ssh key value!
$ cd kubespray/contrib/terraform/aws


$ terraform init


$ terraform plan --var-file="credentials.tfvars"


$ terraform apply --var-file="credentials.tfvars"
#NOTE enter yes to approve the apply
#NOTE: Save the terraform output, as we'll need the inventory later
#NOTE: to delete the resources after the next step, terraform destroy --var-file="credentials.tfvars"
this assumes we've setup the instances with terraform
(1) Setup Bastion and Run Ansible to Provision K8s Cluster
ssh into one of the created bastions and run following cmds:
$ sudo su


$ apt-get update


$ apt-get install unzip git vim wget python-pip jq -y


$ pip install ansible==2.6.5
add the pem key for the machines to the bastion as id_rsa chmod 400 on it
$ git clone https://github.com/kubernetes-sigs/kubespray.git


$ cd kubespray


$ pip install -r requirements.txt
add hosts file from the tf output to kubespray/inventory/hosts: the [all] section to the loadbalancer
remove the bastion entries and bastion host group in hosts file
in the kubespray/ansible.cfg, private_key_file=<path-to-key>/id_rsa
$ ansible-playbook -i ./inventory/hosts ./cluster.yml -e ansible_user=ubuntu -b --become-user=root --flush-cache
Coffee break :) !
(2) Cluster has been provisioned.
Login, run some kubectl cmds to verify things are healthy (kubectl get nodes, kubectl get po --all-namespaces, etc)
Once you're satisfied, delete the instances from the terraform machine with the following cmd (in the kubespray/contrib/terraform/aws dir)
$ terraform destroy --var-file="credentials.tfvars"
Helpful Monitoring Tips for your Kubernetes Clusters
In most projects, it seems monitoring comes last. It's an after-thought. The focus always seems to be on the tangible benefits, like feature development and what the end user sees. That's great, but as the codebase grows, so does complexity.
November 25, 2019
Helpful Monitoring Tips for your Kubernetes Clusters
November 25, 2019
In most projects, it seems monitoring comes last. It's an after-thought.
The focus always seems to be on the tangible benefits, like feature
development and what the end user sees. That's great, but as the codebase
grows, so does complexity. Every line of code is incurring a debt. To
monitor that debt effectively, we need observability into the system with
some type of filter that only alerts us on relevant issues, so that we can
take immediate action. Imagine a car with no gauges for low fluids. As you
could imagine, there'd be plenty of frustrated drivers and broken down
vehicles. Similarly, for a healthy software ecosystem, as engineers, we
need to ensure we're monitoring and alerting effectively. That said, now
introduce Kubernetes, a container platform that encapsulates the best
practices from an operations engineer out of the box (with scalability,
fault-tolerance, disaster recovery, etc). With the many provisioners,
standing up Kubernetes is becoming easier and almost without thought. Every
boat or elevator has a weight limit. So does a Kubernetes cluster. The more
tenants that onboard or as the functionality of the workloads increase, so
does the resource consumption. In this article we'll cover some crucial
aspects to monitor and alert in our Kubernetes (or OpenShift) clusters.
We'll use PrometheusRule expressions to illustrate tangible alertible
expressions. However, keep in mind - the expressions aren't as important as
the bigger picture. The most important information is how to effectively
monitor node metrics, disk capacity, and node state in a cloud agnostic and
opensource manner.
Single Pane of Glass for Metrics, Monitors, Alerts - opensource and cloud
agnostic
If you've considered Kubernetes, the ability to be cloud agnostic is most
likely an appeal. Taking that same approach to our metrics, monitors, and
alerts, consider Prometheus and AlertManager. If you haven't already added
Prometheus to your K8s cluster, checkout the Prometheus Operator.
The beauty with K8s, is that it offers custom resources to be treated as
though native building blocks with the k8s cli. The custom resource in the
cluster that Prometheus leverages are called PrometheusRules, which contain
the logic of which metrics to alert on, thereby sending the alert via
AlertManager. Whether or not you're leveraging Prometheus and
PrometheusRules, these are some things to look out for in day-2 operations
associated with eyes-on the cluster pertaining to compute, storage, and
system state. This includes memory and cpu, free disk left on the nodes and
persistent volumes, and node level inoperable state.
Memory/CPU
Every application consumes memory and cpu. If insufficient resources, then
expect throttled behavior and instability at the least. To have a glimpse
into the resource consumption of our worker bee, the k8s node, the entity
where our applications live, we can monitor available memory and cpu with
the appropriate PrometheusRule expressions: node_memory_MemAvailable_bytes
/ node_memory_MemTotal_bytes * 100 < 20 and 100 - (avg by(instance)
(irate(node_cpu_seconds_total{mode="idle"}[5m])) * 100) > 80. The first
will enter an error state when any node memory surpasses 80%, the second
will enter an error state when any node cpu surpasses 80%. These both would
be expressions for PrometheusRules, configurable via the helm chart.
A general rule of thumb is to have cpu/mem resources consuming 50-60% on
average of the nodes capacity, but it ultimately depends on the types and
purposes of workloads that will be running on your k8s nodes (a side
tangent, be sure to performance test apps!). If you know for sure you have
different types of workloads, some cpu intensive, some memory intensive,
others gpu intensive, be sure to take those inconsideration. Resource
requests/limits will allow the scheduler to place the pods on the
appropriate nodes, so as you can imagine, understanding your apps
performance needs comes in handy here. Another lesson learned here, is the
system-reserved properties on the kubelet come in handy to ensure the
kernel has enough resources reserved when the node is constrained. At the
end of the day, by placing the alert at a responsible alertable threshold
for system level resources, it offers the ability to investigate for
overcommitted nodes, blips in node performance, or the opportunity to
take action before things become evicted.
Disk
Disk can be a nightmare when not properly managed. Anyone ever experience
the situation where your laptop has exceeded its storage capacity? In some
cases it can be unrecoverable and requires the system to be wiped and
reinstalled. Be sure your backing up state to your cluster or cluster
components (velero, cough cough). That said, when disk drives fill up,
things fall over. For example, if kafka's disk fills up, the fancy realtime
ML streaming platform may end up at a screeching halt. Docker daemon is
known to leak memory as well as to use up unnecessarily high levels of
disk. Docker writing to the root disk of the node can cause a node to go
unresponsive, especially if docker isn't managing all the open files
appropriately. If etcd isn't properly managed (use compaction!), and disk
creeps up on it, say bye-bye etcd. The list goes on. So the goal here is to
monitor node-level disk AND application-level disk using a consistent
pattern THAT'S cloud agnostic. A beautiful solution to this is, you guessed
it, leveraging metrics exposed to Prometheus. Two expressions come in handy
here:
expr: (node:node_filesystem_usage:) * 100 > 80 and expr: sum by(job,
persistentvolumeclaim) ((kubelet_volume_stats_capacity_bytes -
kubelet_volume_stats_available_bytes) / kubelet_volume_stats_capacity_bytes
* 100) > 80. The first expression would alert when any drive specific
to the node exceeds 80% capacity. The second expression will alert if ANY
persistentVolume on the cluster exceeds 80%. This is beautiful. The
expressions are completely cloud and application agnostic! No need to have
a separate solution for each type of persistentVolume or the nodes' drives
for each cloud - I love KISS, keeping it simple [and] succint.
Node Level Status
For anyone who has at least played with k8s, the message "Node Not Ready"
would be all too familiar. When this message pops up, expect applications
on the node in question to move around. Depending on the workloads in the
cluster and the amount of extra capacity within the cluster to absorb a
downed node, it could be a domino effect. Two aspects to monitor on are (1)
when a node is not at the "Ready" and (2) When the node is unschedulable.
Here are the Prometheus Rules with the appropriate expressions: expr: sum
by (node) (kube_node_status_condition{condition="Ready",status!="true"})
> 0 and expr: sum by (node) (kube_node_spec_unschedulable) > 0.
The first will alert when any k8s node not in the ready state, e.g
'Unknown' or 'NotReady'. The second expression will alert if a node is
unschedulable. Note that a node can be healthy in the "Ready" state, yet
unable to schedule pods by the scheduler due to it being "unschedulable".
Any time an automated script fails while cordoning/uncordoning a node or
for the case where a system administrator simply forgets to uncordon a node
during maintenance hours in the wee morning, this alert will come in handy.
Conclusion
This article goes over the valuable expressions that are cloud agnostic
with an opensource technology that can empower the administrators of your
k8s platform. Even if the PrometheusRule expressions don't make sense upon
first glance, the concepts are of more importance. Consider a means for
alerting node metrics, disk capacity, and node state to gain confidence in
your containerized platform of choice. Knowledge is power. Using Kubernetes
effectively is empowering. The key word is - effectively. By having insight
and observability into day-to-day operations of the platform you'll be able
to have a well-managed Kubernetes ecosystem.
AWS - Enlarging EBS Volumes for EC2
You ever experience a problem enough times you find value in writing it down for future reference?
This is one of those times. When increasing the EBS volume size in the Amazon console (or aws cli), the machine that the EBS volume is attached to won't register the new size. To ensure the EC2 instance reflects the actual disk size, here are some commands:
November 30, 2019
AWS - Enlarging EBS Volumes for EC2
November 30, 2019
If the EBS volumes are associated with a pv in k8s that's been created by a storageClass, then checkout the allowVolumeExpansion flag.
The rest of this article discusses the hidden tech debt with increasing the EBS volume size in the console.
You ever experience a problem enough times you find value in writing it down for future reference?
This is one of those times. When increasing the EBS volume size in the Amazon console (or aws cli), the machine that the EBS volume is attached to won't register the new size. SO to ensure the EC2 instance reflects the actual disk size, here are some commands:
(0) go to the aws console and identify both the machine the EBS volume is attached and the volume name given to the attached EBS volume, e.g. /dev/sda1.
- NOTE: the name from step (2) of the EC2 perspective, will be /dev/xvda1 for the drive /dev/sda1 in the console
(1) ssh into the instance the EBS volume is attached
(2) run the command: df -h. The EBS volumes will look something like /dev/xvda1 or /dev/xvd...
(3) identify the EBS volume to increase from the EC2's perspective
(4) from the EBS volume identified, run the command: resize2fs <volume-here>, i.e. resize2fs /dev/xvdbf
(5) Validate if the new 'Avail' disk size is reflected: df -h | grep <volume-here>, i.e. df -h | grep xvdbf
(6) If applicable, update any automation to ensure it reflects the change in the storage size!
Combatting the K8s PLEG
When it rains it pours. The PLEG bug has been around from k8s 1.6 to 1.15. Although rare - when it occurs, half the cluster can go down within minutes. Either upgrade your k8s cluster to mitigate the risk of the PLEG or properly manage it.
December 4, 2019
Combatting the K8s PLEG
December 4, 2019
Over the past number of years managing production k8s clusters, this has always come up at unexpected times. In the few handful of times I’ve seen this, the impact can be catastrophic; in minutes k8s nodes can fall over like dominoes. Imagine a k8s cluster with applications that provide client health information or perform financial transactions, and half the cluster goes down. What then? Not the most pleasant predicament to be in. Fortunately, the PLEG issue has said to be resolved in the more recent version of k8s 1.16. I’m always amazed by the k8s community! Unfortunately, it leaves all others clusters still using versions 1.6 to 1.15 exposed by the PLEG issue. As a k8s administrator, I know first hand the difficulty associated with upgrading a cluster in place or migrating stateful workloads to a newer versioned k8s (or OpenShift) cluster. This article is for those who don’t have the option of easily upgrading their cluster. Of course, it’s highly recommended to upgrade your cluster, but here’s an interim solution until then. TL/DR: the solution that I’ve seen come up at various organizations is by adding script that watches for docker timing out, then restarting docker accordingly.
In short, it comes down to a script monitored by systemd with push based notifications. A script, let’s call it pleg-preventer.sh
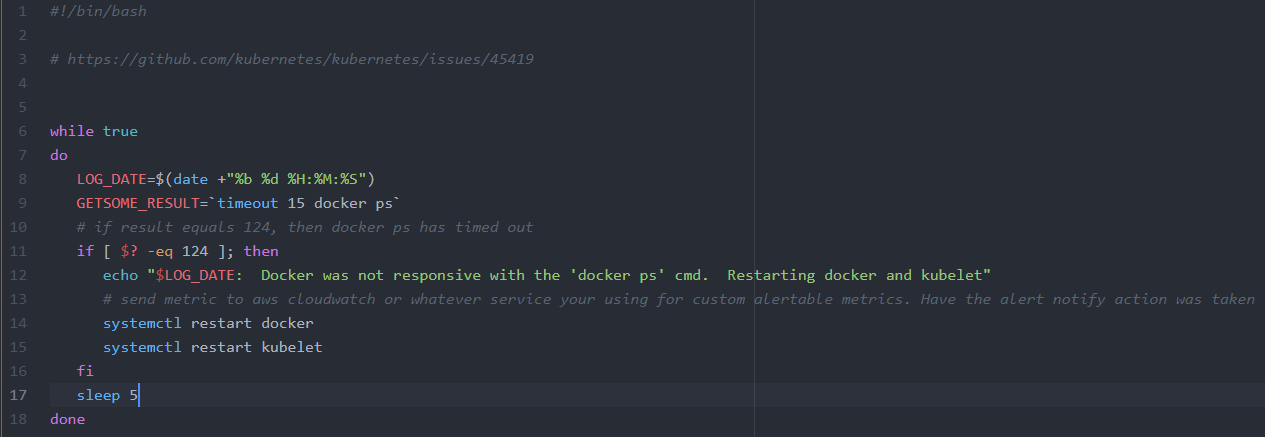
This will watch for docker to become unresponsive with a timeout command. If docker takes too long to return any result, the script will then restart docker and send a notification to an alert channel whenever this script takes any action.
The systemd file, pleg-preventer.service is as follows:
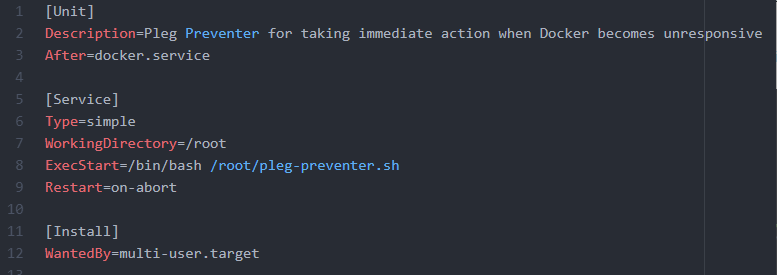
If leveraging AWS to host your k8s cluster, cloudwatch and sns are an obvious choice for managing custom metrics and forwarding along alerts. If google, stackdriver. If on-prem, use your notification tool of choice.
As a systems administrator, automation is key. Being able to reproduce results an idempotent fashion is an ideal scenario. This snippet would be contained in an ansible role that assumes the pleg-preventer files in its files directory.
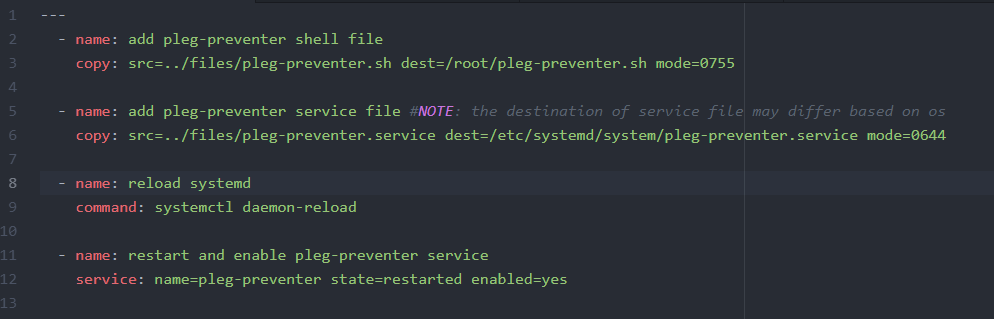
If one were to add in the automation of sending to a custom sns topic, then consider leveraging jinja and the template module via ansible.
In conclusion, this PLEG issue has been observed from k8s version 1.6 to 1.15. The fix has been incorporated into k8s v1.16. Considering the difficulty of upgrading or migrating stateful workloads to a newer cluster, depending on how the cluster has been provisioned, this solution has been vetted for production grade clusters for a number of years at various institutions and can be leveraged until a v1.16 or later cluster has been utilized.
Safely Handling PII Data with K8s
Working with sensitive data requires a high moral responsibility towards your customers. Take advantage of what k8s has to offer without relenting on security or privacy of customer PII data.
December 8, 2019
Safely Handling PII Data with K8s
December 8, 2019
Working with sensitive data requires a high moral responsibility towards your customers. In the world of container platforms, the level of effort to manage dynamic and complex workloads has drastically decreased. A system like k8s consolidates years of platform best practices in a single offering. To leverage those best practices, while committing to the security and privacy of your customer data, consider these approaches for encryption at rest, encryption in transit, and properly managing PII data in logs.
Encryption at Rest
If using GCP, then this is easy as all disks are encrypted by default. When using AWS to host your cluster, be sure to have your EBS volumes for the nodes encrypted. For the applications residings on k8s (aka pods), make sure that the underlying disk is encrypted. If the aws cloud provider isn’t being leveraged to dynamically create EBS volumes, then highly consider leveraging it to reduce the responsibility of your k8s administrators! The parameter flag of encrypted: "true" can be added to the storageClass to ensure the EBS volumes tied to the pv’s are encrypted. K8s assumes Iaas, that said, it is very nice to have your stateful workloads such as databases be maintained by the cloud provider of choice. If elasticache, rds, or other managed cloud products are leveraged, be sure the underlying drives to those services are encrypted. From an auditing and enforcement perspective, check out cloud custodian to enforce encryption. It’s not what you preach, but what you tolerate - stop any configuration mishap early with the proper enforcement tools.
Encryption in Transit
Configuration for ssl traffic from within the cluster (e.g. custom certs vs certs created per cluster, etc) will be dependent on the provisioner used. For ingress objects, use the tls property with a k8s secret for the ssl certificate. One aspect that should be considered is to leverage PodSecurityPolicy to restrict hostPorts. It may be tempting as a developer to open a port to the application via a hostPort to test an application without having to create an ingress object and a secret containing the tls certs, HOWEVER, this can bypass tls communication - exposing an http endpoint to the application. As a system administrator, adding a podSecurityPolicy to restrict usage of hostPorts is an extra insurance policy towards enforcing encryption in transit. Similar to the point with encryption at rest with externally managed services, highly consider enforcing encryption in transit configuration for any externally managed services with a tool like cloud custodian.
Application Logs
In a vanilla k8s cluster, more cases than not, logs are being sent to elasticsearch. Whereby, elasticsearch most likely won’t have authentication, meaning anyone who’s able to hit the elasticsearch/kibana ui’s will be able to see all the logs. Thus, at minimum one should consider fronting the ingress object with with an oauth proxy that prompts a user to login (assuming the elasticsearch stack is hosted within the cluster). A login can appease the need for authentication, however, authorization is another complexity. With most k8s installers, it’s even less likely there will be any form of authorization within elasticsearch out of the box. This means that if application data is emitting sensitive customer data in the logs (without properly cleaning the logs), anyone who is able to authenticate and login to elasticsearch will be able to see the PII data in plain text. Hence the obvious need for properly managing customer PII data. There are such third party tools to add a layer of authz to elasticsearch. They’ll add an additional cost and an unexpected level of complexity for managing logs. For an opensource solution for incorporating authz to elasticsearch, consider opendistro.
For managing PII data in the logs, either manage the data within the app (scrub in memory) or manage the logs with a sidecar container. For the former - have the app properly encrypt, tokenize, or scrub data in memory before emitting to the app’s log file(s).
Irt the latter: for a vanilla k8s install, the log aggregator (e.g. fluentd or fluentbit) will be running on all the nodes as a daemonset. The daemonset will have an associated config for handling the logs. If one of your tenant teams need to add a fluentd filter to modify how the logs are handled, consider sending the logs to a file other than stdout while running a fluentd sidecar container for their application. The custom log file logic will be handled exclusively via the sidecar container. This way, the tenant team can manage their own fluentd or fluentbit configuration without impacting the config leveraged for every other tenant. If you know your application emits sensitive information within that log file, consider a number of fluentd plugins like record reformer or the anonymizer scrub or encrypt data in your logs.
Properly managing and cleaning logs is an important element easy to miss. By encrypting or scrubbing sensitive fields emitted from the logs and adding a layer of authn/authz to our elasticsearch, we can ensure that we have the proper gates and controls in place to protect customer data within the k8s ecosystem.
Conclusion
In a tech world of ever evolving tools, k8s and containers are a hot commodity. A tool like k8s is revolutionizing platforms and becoming a main staple in organizations across all industries. To leverage the beauty of k8s and container platforms while ensuring a commitment to customer privacy and security, proper procedures and guardrails should be adopted. This article addresses encryption within the cluster and cloud provider levels, enforcement of encryption configuration, and a few ideas for properly managing PII data in application logs.
Velero Tips - Testing & Operationalizing K8s Disaster Recovery
To backup K8s or OpenShift clusters as well as the underlying persistent volumes of the applications running from within the cluster, consider Velero. In this article, we'll focus on testing and operationalizing features of Velero from a system adminstrators perspective.
December 12, 2019
Velero Tips - Testing & Operationalizing K8s Disaster Recovery
December 12, 2019
In k8s or openshift, etcd contains the state of the cluster. For disaster recovery (DR) purposes, one can backup etcd using etcdctl commands, however velero (previously known as heptio ark) can offer this functionality plus offer backups and restores of persistent volumes in an agnostic way.
What this article isn't: it's not for basic setup docs or basic cli usage. For that see the stable velero helm chart and velero cli docs.
What this article will focus on: focuses on setup and testing of velero backup and restore from a system administrator's perspective.
Helpful tips before we get started:
- to leverage the backups and restore of underlying disk, see the volumeSnapshotLocation property in the velero helm values file.
- if leveraging velero to backup and restore to other clusters, the CLUSTERNAME property will come in handy.
- info here for v1.1.0. Be sure to double check with the version being used!
- if you don't have a tool like kiam that restricts pods permissions, then check it out. Otherwise, be sure to grant the velero pod least privileged permissions
- here is the permissions info for v1.1.0. Be sure to double check with the version being used!
- to backup AWS EFS, one will need restic: issue here
- upgrade to latest velero version for backup optimizations (v1.2.0 as of time of writing)
- once velero is up and running, consider adding backup schedule with cron AND alerts should any backup fail
Stateful application for testing purposes
(assumes a namespace of test-mysql and storageclass of AWS EBS with gp2 type)
Note:
Depending on where you're testing velero, the storageclass specs will change. Below contains (a) the yaml for deploying mysql (b) commands for populating the database for the testing scenarios
(a) THE YAML:
---
apiVersion: v1
kind: Namespace
metadata:
  name: test-mysql

---
apiVersion: storage.k8s.io/v1
kind: StorageClass
metadata:
  name: gp2
parameters:
  type: gp2
provisioner: kubernetes.io/aws-ebs
reclaimPolicy: Retain
volumeBindingMode: Immediate

---
apiVersion: v1
kind: Service
metadata:
  name: wordpress-mysql
  namespace: test-mysql
  labels:
    app: wordpress
spec:
  ports:
    - port: 3306
  selector:
    app: wordpress
    tier: mysql
  clusterIP: None

---
apiVersion: v1
kind: PersistentVolumeClaim
metadata:
  namespace: test-mysql
  name: mysql-pv-claim
  labels:
    app: wordpress
spec:
  accessModes:
    - ReadWriteOnce
  resources:
    requests:
      storage: 20Gi
  storageClassName: gp2

---
apiVersion: apps/v1 # for versions before 1.9.0 use apps/v1beta2
kind: Deployment
metadata:
  name: wordpress-mysql
  namespace: test-mysql
  labels:
    app: wordpress
spec:
  selector:
    matchLabels:
      app: wordpress
      tier: mysql
  strategy:
    type: Recreate
  template:
    metadata:
      labels:
        app: wordpress
        tier: mysql
    spec:
      containers:
      - image: mysql:5.6
        name: mysql
        env:
        - name: MYSQL_ROOT_PASSWORD
          valueFrom:
            secretKeyRef:
              name: mysql-pass
              key: password
        ports:
        - containerPort: 3306
          name: mysql
        volumeMounts:
        - name: mysql-persistent-storage
          mountPath: /var/lib/mysql
      volumes:
      - name: mysql-persistent-storage
        persistentVolumeClaim:
          claimName: mysql-pv-claim

---
apiVersion: v1
kind: Secret
metadata:
  name: mysql-pass
  namespace: test-mysql
  labels:
    app: wordpress
type: Opaque
data:
  username: YWRtaW4=
  password: YWRtaW4=
(b)
kubectl exec into the created mysql pod and run the commands:
mysql -u root -p
TYPE the password of:
admin
(only 1 time):
CREATE DATABASE sampledb;
Use the database once created:
USE sampledb;
Create the table:
CREATE TABLE IF NOT EXISTS equipment ( equip_id int(5) NOT NULL AUTO_INCREMENT, type varchar(50) DEFAULT NULL, install_date DATE DEFAULT NULL, color varchar(20) DEFAULT NULL, working bool DEFAULT NULL, location varchar(250) DEFAULT NULL, PRIMARY KEY(equip_id) );
Create a value in the table:
INSERT INTO equipment (type, install_date, color, working, location) VALUES ("Slide", Now(), "blue", 1, "Southwest Corner");
Verify data:
SELECT * FROM equipment;
EXPECT TO SEE:
+----------+-------+--------------+-------+---------+------------------+
| equip_id | type  | install_date | color | working | location         |
+----------+-------+--------------+-------+---------+------------------+
|        1 | Slide | 2017-03-24   | blue  |       1 | Southwest Corner |
+----------+-------+--------------+-------+---------+------------------+
1 row in set (0.00 sec)
Testing scenarios to consider
(0) backup whole cluster, delete some namespaces and recover (not testing the deletion of the underlying disk for any pv's)
- velero create backup whole-cluster-test --snapshot-volumes
- delete namespaces or resources to recover, e.g. kubectl delete ns istio, kubectl delete ns test-mysql
- velero restore create whole-backup-expected --from-backup whole-cluster-test or velero restore create specific-namespace --from-backup whole-cluster-test --include-namespaces=<desired-namespace>
- verify the deleted resources are now restored
(1) backup with specific label/namespace, delete the k8s resources, recover with label/namespace
- tip to start with: velero create backup test-selector-backup --selector app=wordpress
(2) backup EBS, delete app and EBS, recover and verify EBS with proper tags AS WELL the data is preserved using the cmds from (b)
- tip to start with: velero backup create mysql-persistent --selector app=wordpress --snapshot-volumes
(3) create a schedule and verify backup has been created from the cron
- velero create schedule whole-cluster-backup --schedule "00 7 * * *"
Conclusion
This outlines tips with leveraging ark/velero to its full potential. It also offers common test scenarios, in particular, a scenario to successfully backup and restore a stateful application with velero.
Day 2 Operations with K8s Best Practices
From someone just getting into k8s, just provisioned a cluster, or a seasoned k8s veteran looking to get some ideas on improving their k8s setup - this article goes over best practices.
December 17, 2019
Day 2 Operations with K8s Best Practices
December 17, 2019
So you’ve either created a cluster and thinking now what, looking into setup of k8s and aren’t sure of next goals once the cluster has been setup, or you’ve been running a k8s cluster in production and are wondering how to improve your k8s ecosystem. To take your k8s platform to the next level, or to simply consider best practices with k8s, consider the below options for enhancing your k8s cluster with cluster alertables, improved security, CI/CD offerings to tenants your tenants, and best practices.
Cluster Level
- rbac
- HA and enough instances/resources for control plane
- etcd will handle up to (n-1)/2 failures
- horizontal scaling in place
- tuned to expected load and resource guard rails in place: resourcequotas and limits
- for the cluster automation use an auditing tool for Infrastructure-as-code, and alert on any differences
Security
- privileges w/ kiam or equivalent
- network policies
- only ssh into nodes through vpn or bastion
- pod security policies
- authn/authz for all applications
- authn with something like oauth proxy
- authz may not be supported for a given app
- encrypt k8s secrets
Dashboard
- Remove the skip button
- add a ttl (as a parameter)
- lock down permissions with rbac
Disaster Recovery
- velero backups
- outline strategy for failover
CI/CD
- [repeatable] pipeline in place for tenants
- consider gitops process with helmRelease objects
Logging
-ensure enough resources for elasticsearch (es) based on retention
- memory and storage, as es is a memory hog!
- add a cleaner (see elasticsearch-curator helm chart)
- capture audit log
- alertables from suspicious activity
Alertables
- cpu/mem
- node notReady or other resources not up
- pv/storage size available
- offer process for tenants to add their own alertables for their pods
K8s Logging with FedRAMP and FISMA High Reqs
Here are constraints, logging config, and lessons learned from building a k8s platform that obtained an ATO appeasing FedRAMP and FISMA High Reqs in AWS GovCloud.
December 24, 2019
K8s Logging with FISMA and FedRAMP High Reqs
December 24, 2019
Must-haves
- Have 180 days of queryable logs
- long term store of logs (usage of S3 and Glacier)
- audit logs, system level logs, and application logs captured
This assumes a few things:
- enabling audit log from the apiserver (configurable to the apiserver). Most likely, an option with your provisioner of choice.
- a config via kubespray:
  # audit support
  kubernetes_audit: false
  # path to audit log file
  audit_log_path: /var/log/audit/kube-apiserver-audit.log
- fluentd container with ability to write to S3, see https://github.com/bfraz/fluentd-s3 for an example
- instance profile or usage of kiam for fluentd to write to S3
- rsyslogs on all nodes, writing to /var/log/rsyslog.log
- drop-in config for fluentd via the elastic-stack helm chart
- assumes the audit log file at particular location, which can be overwritten
Lessons learned
- based on retention, give ample memory, cpu, and disk resources to elasticsearch (needs will grow as more tenants onboard)
- IF at all possible, keep elasticsearch external to cluster or isolate it via taints/tolerations.
- IF elasticsearch goes down, and fluentd/fluentbit isn't able to write to it, logs will fill up disk. If the disk is writing to the root volume of the node, nodes can go unresponsive due to filled-up disks. This could cause a cluster outage.
- Use elasticsearch curator to remove any unneeded logs
Fluentd Config for the elastic-stack Helm Chart
configMaps:
...
system.input.conf: |-
<source>
@type tail
# audit log path of kube-apiserver
path /var/log/kubernetes/audit/kube-apiserver-audit.log
pos_file /var/log/kubernetes/audit.pos
format json
time_key time
time_format %Y-%m-%dT%H:%M:%S.%N%z
tag audit
</source>
<source>
@type tail
@id syslog-k8s
path /var/log/rsyslog.log
pos_file /var/log/rsyslog.pos
<parse>
@type regexp
expression /^(?<time>[^ ]* {1,2}[^ ]* [^ ]*) (?<host>[^ ]*) (?<ident>[a-zA-Z0-9_\/\.\-]*)(?:\[(?<pid>[0-9]+)\])?(?:[^\:]*\:)? *(?<message>.*)$/
time_format "%b %d %H:%M:%S"
</parse>
tag rsyslog
</source>
output.conf: |
# Enriches records with Kubernetes metadata
<filter audit>
@id kube_api_audit_normalize
@type record_transformer
auto_typecast false
enable_ruby true
<record>
host "#{ENV['K8S_NODE_NAME']}"
responseObject ${record["responseObject"].nil? ? "none": record["responseObject"].to_json}
requestObject ${record["requestObject"].nil? ? "none": record["requestObject"].to_json}
origin kubernetes-api-audit
</record>
</filter>
<match **>
@type copy
<store>
@id elasticsearch
@type elasticsearch
...
</store>
<store>
@type s3
<instance_profile_credentials>
</instance_profile_credentials>
s3_bucket <some-s3-bucket-here>
s3_region <aws-region-here>
path logs
<buffer>
@type file
path /var/log/fluentd-s3/s3
timekey 3600
timekey_wait 5m
chunk_limit_size 256m
</buffer>
<secondary>
@type file
path /var/log/fluentd-s3/s3/some_failed_records
</secondary>
time_slice_format %Y%m%d%H%M
</store>
</match>
Lessons Learned from FedRAMP High + AWS GovCloud + K8s + FISMA High Reqs
In building out one of the first known FedRAMP K8s cluster on AWS with FISMA High requirements, here are a snapshot of patterns leveraged in the designed and implementation of the platform.
December 27, 2019
Lessons Learned from FedRAMP High + AWS GovCloud + K8s + FISMA High Reqs
December 27, 2019
Encryption At Rest and In transit
- See our blog on handling PII data with K8s
Logging with RETENTION
- Logging at system level, k8s level, network level and audit level
- Kept logs in elasticsearch with a retention of 180 days, with a backup in S3 with lifecycle policy to Glacier for long-term storage
- See our blog on FedRAMP High with FISMA High Logging Reqs on K8s
Backup and DR
- velero backups of cluster resources and storage level backups
- see our blog on velero
RBAC with LDAP integration - authn and authz
- ldap policies around credentials: password reset after so many days
- separation of concerns with who can deploy, who can develop code, who has admin/edit access to k8s, etc
- authn to all apps in k8s with ui's
- authz to applicable applications within k8s
Onboarding Plan for Tenants - what's a platform with no tenants?
- repeatable plan for monitoring/alertables, logging, CI/CD, etc
- check out our container checklist blog!
Security, Security, Security
- scanning containers for security exploits - consider tool like twistlock, sysdig, etc
- vpn and bastion to access cluster level resources
- network policies, psps, oh-my
Container Checklist - for Onboarding or New Image Releases
For onboarding an app to K8s, ever wondered what the steps would be? This checklist offers considerations for any new app or for any new feature to an existing app on Kubernetes.
January 1, 2020
Container Checklist - for Onboarding or New Image Releases
January 1, 2020
Here are considerations and questions to consider when either adding a new containerized app or a new feature to an existing app:
Purpose / Use Case
- What is the use-case this new app or new feature of the app offers to customers?
- Any particular technologies or architectures this is dependent on, e.g. streaming, batch, api-gateway. etc. ?
Storage
- What kind of storage requirements does your app have?
- Block based, object based, file based?
- Read-write many?
- Size specs?
- Does it have to be HA?
- Will backups with velero be sufficient?
- Is a database or cache used?
- If so, see networking section
- If so, who is expected to maintain the database or cache?
Resources
- what’s the expected mem/cpu/gpu needed for your app?
- does your app have limits and requests?
- be sure to performance test your app to have these baselines!
Networking
- does your app require access to any entity outside the cluster?
- if so, how so: inbound, outbound, or both?
- does your app have a ui?
- if so, what’s the authn/authz for the app?
- talk to your system administrator for how ssl certificates are managed for endpoints.
DR
- what is expected SLA of the app?
- in case of failure, what are the remediation steps?
- are they manual, is it automated?
- if manual, are they clear and concise?
- who is responsible for failures?
- will you be managing your own backups?
Permissions
- what special permissions does your app need?
- talk with your system administrator for how roles are managed, e.g. kiam, etc.
CICD
- talk to your system administrator about the CICD process, e.g. helmRelease crds with flux, argo cd, jenkins, etc
- how is configuration managed?
- where is the image stored, e.g. custom registry?
Logging
- does the containers write logs to stdout and send errors to stderr?
- does the app handle PII data?
- If so, does it emit any in the logs. See our PII blog
- is the level of logging (e.g. debug, info, etc) configurable from outside the app?
Metrics
- does your app have a means for liveness and readiness probes?
- does your app have a means of a ServiceMonitor?
Alertables
- do you have alerts setup for any failures of the app?
- who will be responsible for alerts?
Container Specs
- can your app handle unexpected termination without loss of data?
- is your app expected to scale?
- If so, vertically or horizontally?
- Has the app been performance tested to know a baseline for scaling?
EKS Basics and Automated Approach
Review the basics of EKS and learn about an automated approach for provisioning EKS as well as the ecosystem of tools that reside on it, from external-dns to aws-alb-ingress-controller for dynamically provisioning AWS resources in support of applications on EKS.
February 1, 2020
EKS Basics and Automated Approach
February 1, 2020
Broadly, EKS is a managed Kubernetes cluster on AWS. It manages the control plane of the cluster across multiple AZ’s and offers the flexibility of where the workloads will run, such as in Fargate, EKS Managed Nodes, or on EC2. If convenience and quickness of scale is more preferred, then Fargate is recommended. If the ability for customization is desired, then EC2 would be the goto. Over the past several years, I’ve personally worked with various organizations in locked-down environments to provision Kubernetes and optimize workloads across various machines. Managed Kubernetes services lower the bar in complexity and cost, allowing organizations of any size to leverage the power and resiliency of Kuberentes. This article addresses basic concepts with an automated solution towards utilizing AWS EKS.
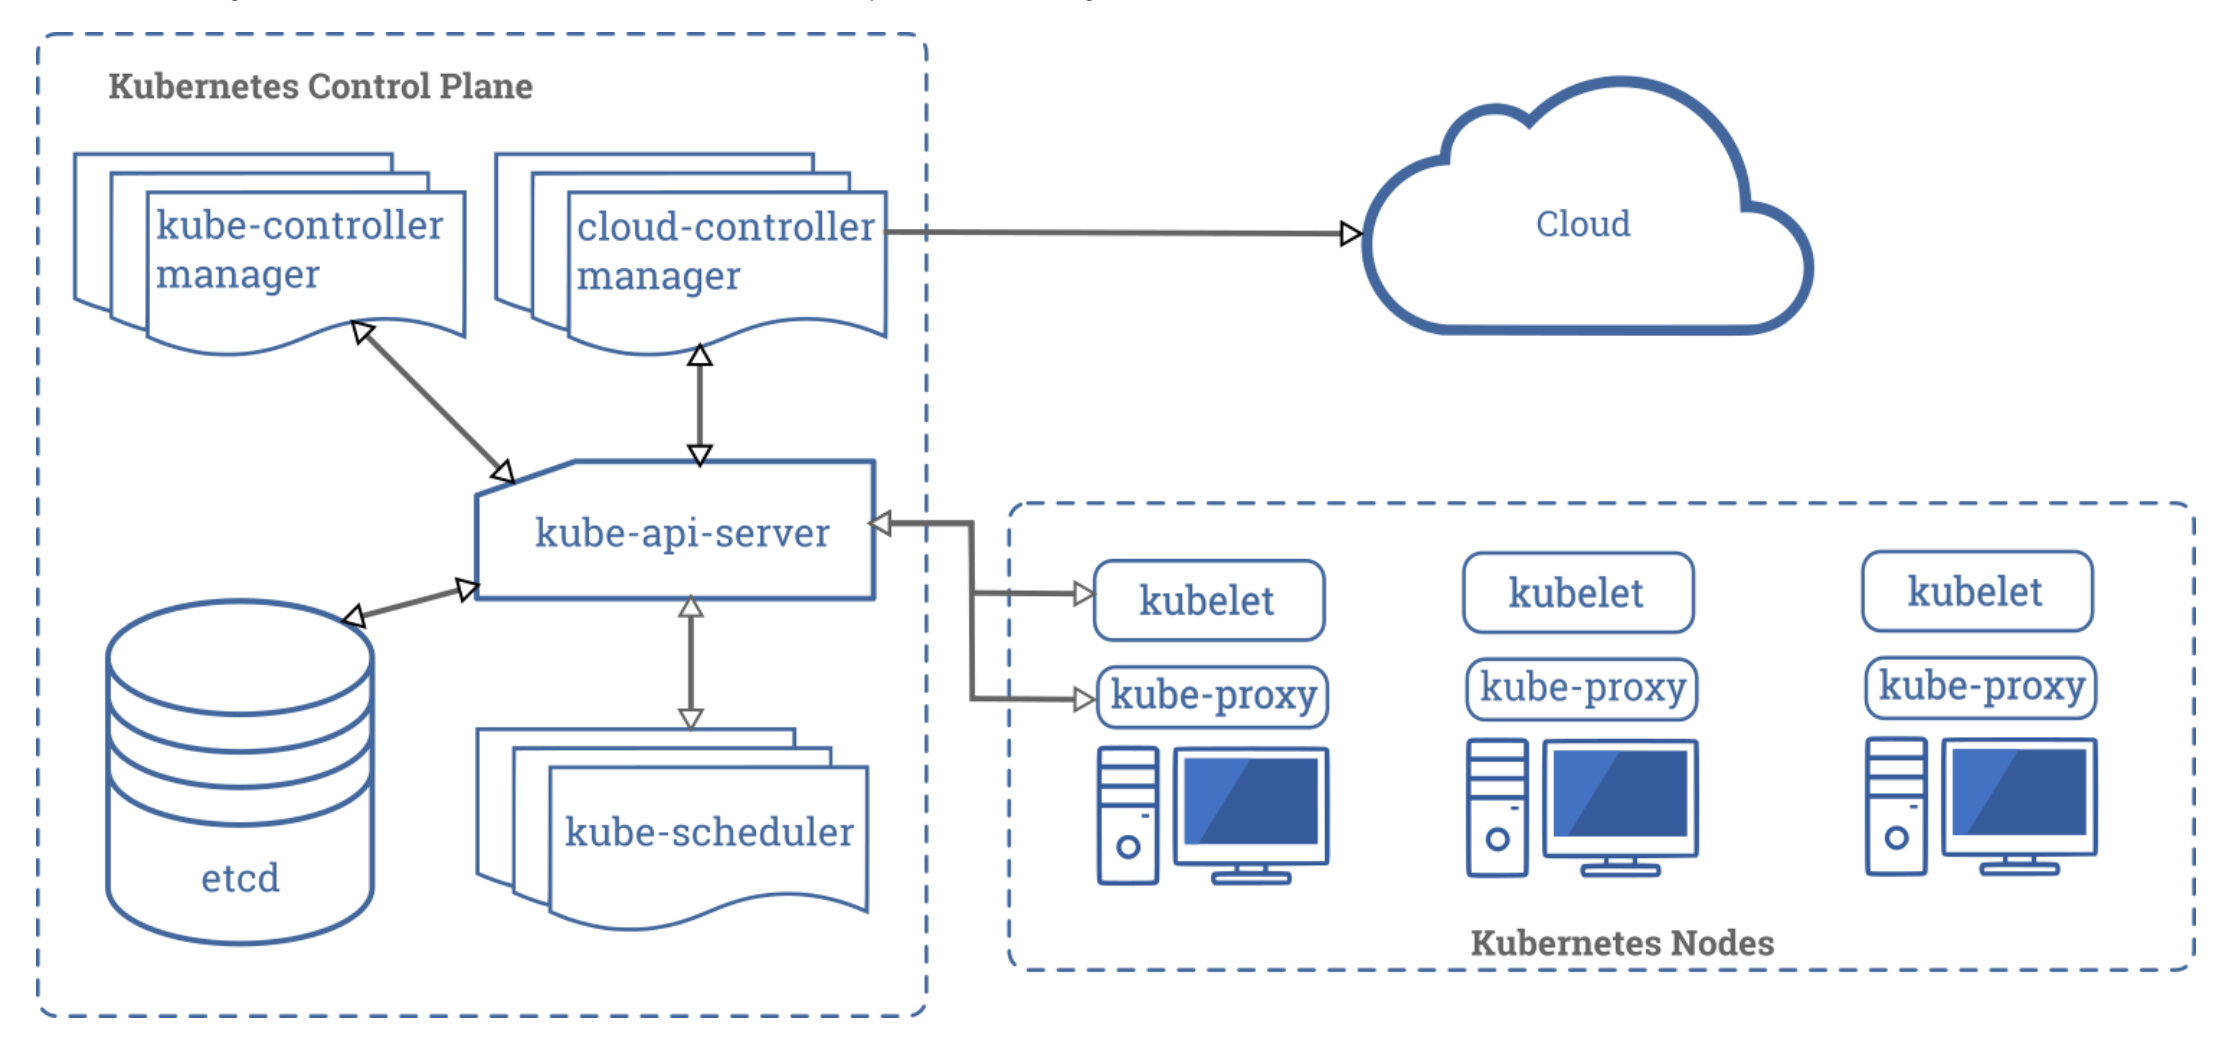
Before We Begin
For a k8s overview, check out the official Kubernetes documentation. Here’s a great illustration of the various components:
 Logging, RBAC, & Networking on EKS
Streamlined Auditing and Logging with CloudTrail and CloudWatch. Keep track of the calls to the API server via CloudTrail and leverage the fluentd-cloudwatch plugin to send all logs there. Both have the ability for long-term storage to S3 (where logs can be shipped to Glacier after some amount of time).
There is an AWS IAM Authenticator which allows IAM roles to map to K8s service accounts for RBAC within the cluster. Although convenient, to stay more cloud provider agnostic, check out tools like kube2iam and kiam. Kube2iam has been known to not clean up after itself, which could make Kiam a more noteworthy option. However, if the cost is a concern, consider kube2iam, as a few extra nodes solely for kiam servers won’t be required (architecture on running kiam on EKS here).
As far as networking, leverage the familiar AWS VPC/Subnet concepts with EKS. Even deploy the cluster in subnets located in private subnets and expose ingress objects via a public-facing load balancer for tighter controls.
Alleviated Costs
The obvious costs with running a cluster would be the hourly bill for the control plane, even more if etcd is running on separate machines. A HUGE hidden cost is upgrades and maintenance. Minor version upgrades can be handled for you. Major upgrades from the control plane can fall back in case of failures. See awsdocs on this for further details. Why pay a premium and endure a steeper learning curve for employees/contractors when managing or deploying Kubernetes, when a managed service reduces the complexity and lowers the bar of deployment?
Automated Solution
A key aspect of devops is automation. An example leveraging terraform to provision an EKS cluster with EC2 worker nodes and ansible playbooks to provision the tooling that resides on the cluster can be found here: (https://github.com/consistent-solutions/eks-with-day-two-operations). The terraform will provision the VPC with private and public subnets, then deploy the EKS cluster in private subnets. It offers a bastion and a workstation. The workstation has the proper setup to be able to interact with the cluster without having to publicly expose the control plane. The ansible leverages helm v3 (not using tiller) and community helm charts to deploy kube2iam for RBAC, external-dns for dynamically managing ingress cnames, fluentd-cloudwatch for sending container logs to cloudwatch, velero for backup up cluster workloads and persistent volumes to S3 at regular intervals, prometheus-operator (for deploying grafana, prometheus, and alertmanager for monitoring/alerting), AWS Cognito for authentication to ingress objects, AWS EBS for application stateful workloads, and the aws-alb-ingress-controller to dynamically expose ingress objects with AWS ALBs. This solution offers a native terraform/ansible approach for extending it to other environments (environments such as qa, sandbox, prod, etc). The repo README contains the step-by-step instructions for setup and teardown.
Conclusion
By leveraging EKS, we can reduce monetary and operational costs associated with running a Kubernetes cluster while keeping the tooling relatively agnostic. To have a reproducible means for the K8s cluster as well as the ecosystem of tooling that resides on it, we can leverage an automated modular approach like the example demonstrated. For further questions or special considerations, feel free to reach us via the contact us section below.
A Well-Managed Docker Daemon
The docker daemon has been known to consume resources. While developing with docker, I’ve had to clean up docker resources every few months. Here are several tips that have been handy to get back in the game.
March 8, 2020
A Well-Managed Docker Daemon
March 8, 2020
While developing with docker, ever seen the message: 'FATAL: could not write lock file ____.pid' or 'No space left on device'? Here are a few commands to consider invoking to clear up your system. Note that this will remove docker resources, so be sure you have a means of accurately reproducing [stateful] containers.
System Prune
Will remove all stopped containers, unused networks, dangling images & dangling build cache (for docker version 1.13 or later)
$ docker system prune
Stop & Remove All Docker Containers
Before copy and pasting this, keep in mind this will stop currently running containers. If you only wish to remove dangling resources, then skip this.
$ docker stop $(docker ps -a -q)
$ docker rm $(docker ps -a -q)
Remove All Dangling Volumes
$ docker volume rm `docker volume ls -q -f dangling=true`
Delete All Local Images
$ docker rmi -f $(docker images -a -q)
Conclusion
The above commands will free up disk and other resources. If you’re worried about docker being destructive on your k8s nodes, checkout this k8s monitoring blog for prometheus disk monitoring tips. Before thinking 'there's no way docker can be destructive', there are plenty of ways it can wreak havoc: from filling up disk, to not properly closing open files on the os, to not properly reporting to the kubelet (causing the PLEG issues for k8s versions 1.6 to 1.15). I hope this helps! For any other questions, feel free to reach out via the contact us form.
Distributed Analytics with Jupyter Notebooks on GCP
Empower your Data Scientists with Jupyter, K8s and Dask on GKE. This post demonstrates how to
quickly and reliably spin-up a distributed analytics enabled infrastructure for Jupyter notebooks. In the example to follow, the Jupyter
notebook performs basic ETL with BigQuery and Google Compute Storage (GCS) via a combination of GCP Python APIs and distributed data processing functionality of Dask.
June 24, 2020
Distributed Analytics with Jupyter Notebooks on GCP
June 24, 2020
Jupyter notebooks are great for basic ETL, exploratory data analysis and model development. However, unless the notebook is being leveraged from a distributed environment and with "out-of-core" enabled data processing libraries, like Dask, the “Bigness” of your Big Data analytics will be severely limited.
In other words, Python data processing libraries, like Numpy, Pandas or Scikit-learn, are limited to datasets that fit into the amount of memory available from the machine they are running on. Also, single thread execution per Python interpreter is imposed by the Python GIL. To deal with these limitations, Dask provides two important extensions of functionality. First, it extends the Numpy Array and the Pandas Dataframe into distributed collections, where the data within a collection can be spread out among multiple cluster nodes or instances. Second, Dask (using DAGs) creates a Task Graph for parallel execution of computations (pure python functions) and distributed data transport (to nodes/instances) that is then executed incrementally (releasing memory along the way) by dynamically scheduling tasks to Dask workers running as pods in your cluster.
In short, from a Jupyter Notebook, leverage Dask on GKE for Python-based analytics at scale via distributed computation and out-of-core algorithms.
Enough talk, let’s get started!
- First, you’ll need a GCP Account and Project.
- Next, clone
https://github.com/consistent-solutions/gcp-dask-jupyter.git
- Follow the instructions outlined in
gcp-dask-jupyter/README.md
NOTE: For simplicity, use a combination of Google Cloud Shell and GCP Web UI for the following.
PROCESS SUMMARY, as outlined in README.md:
- Create a GCP Account, create a Project and activate Billing (not the GCP Free Tier).
- Clone the Gruntwork repo, create terraform.tfvars config file and Terraform that cloud infrastructure!
- As the infrastructure is being provisioned, create a new Dataset within your project from the BigQuery web console and copy over a Table from the public Dataset to the one in your project.
- Add additional IAM roles to 2 existing GCP Service Accounts.
- gcs/bigquery access from jupyter (ETL from Jupyter Notebook)
- gcs bucket access from the cluster (Dask workers accessing bucket csv data)
- Install Helm and Dask (via Helm)
- Access Dask UIs via (Google Cloud Shell) Web Preview by using
kubectl port-forward
- Use
kubectl cp to copy service account credential file to (Dask) jupyter ui pod for access to GCS and BigQuery from the jupyter notebook using GCP Python APIs.
- Create a GCS bucket for csv data loaded from BigQuery for Dask to work with.
- Open Web Preview (via Google Cloud Shell) for the jupyter notebook ui and the scheduler ui.
- Clone
gcp-dask-jupyter and drag and drop a local copy of jupyter-gcs-bq.ipynb into filesystem explorer (left side) of jupyter ui
- RUN THE NOTEBOOK!
Component Breakdown:
- GKE Infrastructure
- Gruntwork
- “...to quickly spin up a GKE Public Cluster, you can run the example that is in the root of this repo.”
- Jupyter Notebook
- Google BigQuery
- Copy Table from public Dataset to a newly created private Dataset and Table.
- google.cloud.bigquery
- Run queries against BigQuery Tables.
- Google Cloud Storage
- Storage of BigQuery Table data as csv files before loading into Dask Dataframe for data processing.
- gcsfs
- Move BigQuery Table data to GCS bucket as multiple csv files.
- Pandas
- “pandas is a fast, powerful, flexible and easy to use open source data analysis and manipulation tool, built on top of the Python programming language.”
- Needed for Dask.
- Dask
- Distributed computation with underlying Pandas, Numpy or Scikit-learn.
- dask.distributed.Client
- dask.dataframe
- Using read_csv, loads GCS bucket csv file data into a Dask dataframe.
Notebook Summary:
The Jupyter Notebook, jupyter-gcs-bq.ipynb first installs needed Python dependencies including google.cloud.bigquery, gcsfs, pandas, dask.distributed.Client and dask.dataframe. Import statements follow after dependencies, including an os.environ call to set Google application credentials environment variable for Jupyter access permissions to GCS and Bigquery. The first cell of interest performs a query against a public Dataset/Table directly from BigQuery. Following that is the true meat and potatoes of the notebook. To begin, the next cell instantiates a Client for Dask, providing a scheduler for upcoming operations. The next cell is basic ETL. It copies data (the public Dataset/Table used a bit ago) from BigQuery to a GCS bucket as multiple csv files. After a confirmation/success message, the next cell lazily loads the csv file data into a Dask Dataframe. The final cell kicks off Dask computation.
NOTE: Switch Web Preview to scheduler ui port to watch as Dask workers get it done!
Conclusion:
At the end of the day Data Scientists should be able to focus on what they do best, Analytics and Data Exploration. They shouldn't have to muck around with
infrastructure and the like. Empower your Data Scientists by providing them with automated infrastructure and workload provisioning on Kubernetes. Empower them by providing
a secure, resilient and repeatable environment supported by a community-driven ecosystem of tooling and best practices. Empower them by providing them with the tooling
that they know and love, and abstract away everything else as much as possible. Trust me, they'll thank you for it!
PostgreSQL Performance Tuning
In almost any app, data is essential. Therefore the uptime and performance of the database for managing said data is crucial. Let's dive into the parameters to get the most out of our PostgreSQL database.
July 16, 2020
PostgreSQL Performance Tuning
July 16, 2020
In almost any app, data is essential. Therefore the uptime and performance of the database for managing said data is crucial. The types of workloads will ultimately drive the type of storage mechanism used as well as the appropriate fine-tunings. In this article, we'll explore the settings for fine-tuning PostgreSQL.
TL/DR- Checkout pgtune as a reference, then considering your workload and the system specs, adjust accordingly.
shared_buffers
The amount of dedicated memory on the server PostgreSQL will use for caching data. You can think of this as a temporal memory space to generate result sets. Typically set to 25% of memory. If the entire database can fit in the cache, then having this as a higher percentage would be beneficial, as this would reduce the amount of reading from disk. Having a higher value would be ideal for heavy read workloads, yet detrimental to high write workloads. In the case of higher write workloads, all the shared_buffer contents would need to be processed. The change of this value will require restarting the PostgreSQL instance.
effective_cache_size
effective_cache_size is an estimate for the memory that is available for disk caching and influences the query planner. If set too low, it can prevent indices from being beneficial. A general go-to conservative value is 50% of memory, which is set from AWS RDS PostgreSQL by default. However, a higher value like 75% may be more beneficial on dedicated db server(s). Consider this value as total memory minus what the OS and other apps/processes on the server.
max_connections
General rule is to keep this low. A few hundred connections depending on the size of the database is low. The more connections at once, the more overall memory consumption. The higher the number of connections, the less memory that can be allotted per connection. When one has a high number connections, watch the overall memory and the work_mem parameter in relation to it. The parameter of work_mem can make operations like sorting faster, however if both work_mem and number of connections is high, one may be at risk of exceeding database memory.
Example calculation of max_connections:
  The default AWS RDS parameter group has: LEAST({DBInstanceClassMemory/9531392},5000)
     with 1G of memory, this would yield: (1024*1024*1024 / 9531392)
     So for db.m4.2xlarge of 32G of memory, max_connections would be ~3600
     and for db.m4.4xlarge of 64G of memory, max_connections would be 5000
maintenance_work_mem
Specifies the total memory available for maintenance operations, such as VACUUM, CREATE INDEX, ALTER TABLE, etc. Be careful to not set this value too high, since this value of memory can be multiplied times the number of autovacuum_max_workers.
General recommendation for maintenance_work_mem:
- Set value 10% of system memory, up to 1GB
- If having VACUUM problems, consider setting it higher
checkpoint_completion_target
Target of checkpoint completion as a fraction of total time between checkpoints.
This is typically 0.5 by default. In theory, 0.9 will give a smoother I/O disk curve over time.“
A value of 0.9 means aim to finish the checkpoint writes when 90% of the next checkpoint is done, thus throttling the checkpoint writes over a larger amount of time and avoiding spikes of performance bottlenecking.”
One can set this roughly with (checkpoint_timeout - 2min) / checkpoint_timeout.
So a value of checkpoint_timeout as 20 minutes would give a value of 0.9 for the checkpoint_completion_target. If in doubt, start with 0.5 observe, increase it by 0.1 or 0.2 incrementally with observing (up to 0.9).
wal_buffers
The amount of shared memory used for WAL that hasn’t yet been written to disk. The range is around 64kB to 16MB, anything larger won’t be very beneficial. The default is typically -1 which will equate to 1/32 (~3%) of shared_buffers. This default should be reasonable. Keeping it relatively small to a few MB can improve write performance on a busy server. Note that a change will take effect upon restart.
random_page_cost
This is the cost of random reads.
Typical default is 4. If using HDD, a value four is justified. However, if using SSD, a setting at 1.1-2 is acceptable. Note that if the database is purely in memory, then it would make sense to have random_page_cost = 1 = sequential_disk_cost.
effective_io_concurrency
Is the number of concurrent disk I/O operations that PostgreSQL can run simultaneously.
Currently, the setting only impacts bitmap heat scans. For reference, with an index-only scan - PostgreSQL pulls from memory. For Bitmap Heat Scans, PostgreSQL will leverage the index to identify which rows to load from disk.
Here's a great article on benchmarking with performance of this parameter.
work_mem
Memory used for sorting as well as joining tables with merge-join and hash-join operations.
In relation to observations in logs:
- If you notice an “out of memory” in PG logs → either decrease work_mem or increase instance size.
- If you notice “temporary files” in the recent logs → consider increasing work_mem
In relation to short vs long running queries:
- If there are few short running queries running frequently → decrease work_mem
- If there are few active queries at a time w/complex sorts and joins → increase work_mem
min_wal_size & max_wal_size
The write-ahead log (WAL) of the db is the accounting of modified records overtime. One can reproduce the database state by reading the WAL log. A database of several hundred GBs can produce TBs of WAL per day. That’s a lot of logs to be replayed in case of a recovery scenario. Thus, a checkpoint is taken at intervals. The checkpoint should be balanced so it doesn’t incur much load on I/O, yet isn’t too large to reduce the point-in-recovery time should a disaster happen.
The parameters to adjust here are checkpoint_timeout, min_wal_size, and max_wal_size. A checkpoint happens either every checkpoint_timeout or when max_wal_size is about to be hit. The default min_wal_size is typically very conservative.
This post has great recommendations of adjusting the 2 params:
- If you know your database write traffic is “bursty” with long periods of inactivity followed by furious writes, increase min_wal_size.
- If you do bulk loads larger than 1GB, increase max_wal_size to the size of a bulk load.
- If you write more than 1GB of data every 10 minutes, increase max_wal_size.
- If you get “Checkpoints occurring too frequently” error messages, try increasing both parameters incrementally.
max_parallel_workers_per_gather
Keep in mind this can easily double to quadruple the typical resource consumption. If you’re looking to really get the most out of your database, this will come in handy, however, be sure you understand typical traffic and workloads over time in relation to resource consumption before dialing this up.
Conclusion
In short, you may not be seeing the true potential of your PostgreSQL database with standard defaults. Before fine-tuning, be sure you understand traffic patterns in relation to database workloads, as well as the read vs write intensive nature of the workloads themselves. It is always recommended to have observability of the database metrics, and ideally a performance testing strategy for new app features or traffic patterns. Once the database metrics are observable and the workloads understood, then consider fine-tuning the database. A great start would be leveraging pgtune. That said, it may be wise to revisit fine-tunings upon evolving needs and observations. For any further questions or feedback, feel free to reach out!
GKE Day 2 Operations & Best Practices
Out-of-the-box, GKE provides arguably the most robust and feature-rich managed Kubernetes out there. To follow is a demo of GKE with Day 2 Operations, with
a combination of Terraform and Ansible automation for infrastructure and k8s workload provisioning.
August 3, 2020
(Montgomery Woods State Natural Reserve)
GKE Day 2 Operations & Best Practices
August 3, 2020
When it comes to managed k8s no hosted offering shines quite like Google Kubernetes Engine. With a fully-managed control plane, including security patches and upgrades handled behind-the-scenes, automatic cluster/node upgrades, node auto-repair, cluster autoscaling and node health monitoring via the node problem detector (after being enabled), GKE has many features baked-in, and particularly those that relieve the greatest pain points. The control plane, for instance, is the most difficult aspect of Kubernetes management, and yet on GKE, control plane security, patch management, availability and cost are abstracted away from the customer's concerns.(-->what you can configure)
Metric/Log Export to Stackdriver
Another out-of-the-box advantage gained with Google Kubernetes Engine is Kubernetes Engine Monitoring via Cloud Operations for GKE. For instance, "...Cloud Operations for GKE dashboard displays a summary line for each Kubernetes resource by default." Additionally, cluster components with subcomponents can be drilled into for more granular details from 3 different perspectives- Infrastructure, Workloads and Services. The Cloud Operations for GKE dashboard also includes a timeline of incidents from alerting violations. Cloud Operations for GKE also provides Kubernetes Observability, but only after creating a Workspace. A Workspace is "...for monitoring resources contained in one or more Google Cloud projects or AWS accounts. A Workspace accesses metric data from its monitored projects, but the metric data remains in those projects." Once a workspace is created and your project is associated with it as its host project, the metrics explorer can be used to explore available metrics and then use the web console to manage alerting policies (or the API). Additional builtin functionality includes cluster workloads that support metric/log export to Stackdriver and autoscaling via scaling metrics. Log/metric export consists of fluentd-gke (logs) and gke-metrics-agent (metrics). Metrics based autoscaling is enabled by a (builtin) Deployment of the metrics server as well.
These additional features provide immediate value by facilitating Day 2 Operations out of the box.
The following example demonstrates Day 2 Operations, addressing the concerns of persistent storage (agnostic) & workload state backup/disaster recovery with Velero, k8s RBAC, DNS management with ExternalDNS and SSL cert management via Cert-Manager. ExternalDNS and Cert-Manager support a 2048 (game) externally available with a custom domain and ssl certs. Observability through automation is demonstrated by leveraging Terraform to create GKE based Alerting Policies and a Notification Channel.
To provision GCP infra:
- First, you’ll need a GCP Account and Project.
- Next, clone
https://github.com/consistent-solutions/terra-gke-jumpstart.git
- Follow the instructions outlined in
terra-gke-jumpstart/README.md
NOTE: For simplicity, use a combination of Google Cloud Shell and GCP Web UI for the following.
NOTE: GKE-based Alerts require a Workspace, which currently requires manual creation.
PROCESS SUMMARY, as outlined in README.md:
- Create a GCP Account, create a Project and activate Billing (not the GCP Free Tier) and enable required Google Cloud APIs.
- Clone the terra-gke-jumpstart repo, create terraform.tfvars config file, copy over GKE Alerts and Notification Channel terraform.
- Provision the infrastructure with terraform init, plan and apply then update kubeconfig and check for kubectl access to your cluster.
- Clone gke-with-day-two-operations and run the ansible playbook!
With GCP infrastructure provisioned, the following cluster level features ensure a mature foundational setup, encouraging an ecosystem of tools to provide nothing less than a Day 2 capable platform.
Component Breakdown:
- GKE Infrastructure
- Gruntwork
- “...to quickly spin up a GKE Public Cluster, you can run the example that is in the root of this repo.”
- Cluster Level
- k8s RBAC
- 2048 Game
- ExternalDNS
- "Keeps zones synchronized with Ingresses and Services (of Type=LoadBalancer) in various cloud providers."
- Cert-Manager
- "x509 certificate management for Kubernetes" for Ingress resources via Let's Encrypt (with DNS01 Challenge).
- Velero
- Disaster Recovery. Supported backup scenarios:
- Entire cluster
- By label
- By namespace
- Via cron schedule
- Workload migration
- GCP (Cloud Monitoring) Workspace
- Kubernetes Engine Operations
- Alert Policy
- Define time-series based metric policies to monitor for problems and send alert via notification channel.
- "For clusters configured with Kubernetes Engine Operations, the following monitored resource types are available:
- Notification Channel
- How/where to send the alert (in this case email).
Conclusion:
Day 2 Operations means bootstrapping Kubernetes with the needed workloads and tooling to provide resilience by leveraging Observability in your cluster. With GKE as a foundation, one can implement Day 2 Operations sooner, realizing greater overall reliability and resilience to failure and ultimately delivering valuable agility at scale- the right way, from Day 1.
Managing PostgreSQL Bloat
Bloat significantly slows down database operations. Any time a record is updated or deleted, a dead tuple is created. The space used by a dead tuple is known as bloat. Learn how to identify and mitigate bloat.
September 8, 2020
Managing PostgreSQL Bloat
September 8, 2020
In PostgreSQL, when a record is deleted, it’s not really deleted. It still takes space, known as a dead tuple. The space taken from the dead tuples, that are no longer needed, is known as bloat. Bloat can greatly impact resource utilization and can significantly slow the database, if not properly managed. First identify the offending bloat, VACUUM where appropriate to reclaim storage, and fine-tune the database for proper maintenance.
Identify the Troublesome Tables
A query to identify the tables with most dead tuples:
SELECT relname AS TableName,
n_live_tup AS LiveTuples,
n_dead_tup AS DeadTuples
FROM pg_stat_user_tables
ORDER BY n_dead_tup DESC;
To identify tables with a lot of bloat, see this query.
The last three lines can be adjusted to refine the search criteria of pct_bloat or the amount of mb_bloat, as well as to sort by mb_bloat.
Cleanup Time
The ideal state is to properly tune the database parameters. To clean up the immediate bloat, one would choose between the VACUUM and VACUUM FULL operations. In short, VACUUM FULL will block write operations [to the table(s)] while optimizing the disk [of the underlying table(s)]. VACUUM FULL or an alternative that doesn’t block, such as pg_repack should be considered if there is significant bloat. The next best thing is the VACUUM. It doesn’t optimize the disk space, but does remove dead tuples. Regardless of which command is invoked, be sure to run these during a time with low traffic to the database and follow it up with an ANALYZE command to update database statistics. The updated statistics will ensure the query planner operates efficiently.
Conclusion
In short, any update or delete of a record will amount in a dead tuple. Dead tuples take up space, known as bloat. To ensure the database isn’t negatively impacted by bloat, be sure to properly manage it via VACUUM commands or ideally fine-tune the database.
PostgreSQL Index Cleanup
Most likely the database has been running for many years. It simply works. To improve query performance, add “another index”. However, before simply adding another index, consider purging unneeded indices to improve database performance.
October 2, 2020
PostgreSQL Index Cleanup
October 2, 2020
Are you looking to understand current specs with respect to tables and indexes? Has it been awhile since you’ve reviewed relevancy of your indexes?
Below are a series of commands for basic db table and index analysis.
NOTE: if you’re planning to drop an index, monitor performance before/after. Preferably drop one index at a time and monitor performance as a result. If reprovisioning an index, checkout the CREATE INDEX CONCURRENTLY, as to not block existing operations
List Tables
SELECT * FROM pg_catalog.pg_tables WHERE schemaname != 'pg_catalog' AND schemaname != 'information_schema';
List Indices
SELECT * FROM pg_indexes WHERE schemaname NOT IN ('pg_catalog', 'information_schema');
List DB Table Sizes
SELECT relname AS "table_name", pg_size_pretty(pg_table_size(pgc.oid)) AS "space_used" FROM pg_class AS pgc LEFT JOIN pg_namespace AS pgns ON (pgns.oid = pgc.relnamespace) WHERE nspname NOT IN ('pg_catalog', 'information_schema') AND nspname !~ '^pg_toast' AND relkind IN ('r') ORDER BY pg_table_size(pgc.oid) DESC;
Bonus: Table Bloat and Dead-Tuples
See blog here
An example cleanup command that won’t block on a table as discussed in the above blog:
VACUUM VERBOSE ANALYZE tablename;
Unused Indices
SELECT t.schemaname, t.tablename, indexname, indexdef, c.reltuples AS num_rows, pg_size_pretty(pg_relation_size(quote_ident(t.schemaname)::text || '.' || quote_ident(t.tablename)::text)) AS table_size, pg_size_pretty(pg_relation_size(quote_ident(t.schemaname)::text || '.' || quote_ident(indexrelname)::text)) AS index_size, pg_relation_size(quote_ident(t.schemaname)::text || '.' || quote_ident(indexrelname)::text) AS index_size_bytes,
    CASE WHEN indisunique THEN 'Y'
        ELSE 'N'
    END AS UNIQUE,
    number_of_scans,
    tuples_read,
    tuples_fetched
FROM pg_tables t
LEFT OUTER JOIN pg_class c ON t.tablename = c.relname
LEFT OUTER JOIN (
    SELECT
        c.relname AS ctablename,
        ipg.relname AS indexname,
        x.indnatts AS number_of_columns,
        idx_scan AS number_of_scans,
        idx_tup_read AS tuples_read,
        idx_tup_fetch AS tuples_fetched,
        indexdef AS indexdef,
        indexrelname,
        indisunique,
        pgi.schemaname
    FROM pg_index x
    JOIN pg_class c ON c.oid = x.indrelid
    JOIN pg_class ipg ON ipg.oid = x.indexrelid
    JOIN pg_indexes pgi ON pgi.indexname = ipg.relname
    JOIN pg_stat_all_indexes psai ON x.indexrelid = psai.indexrelid
) AS foo ON t.tablename = foo.ctablename AND t.schemaname = foo.schemaname
WHERE t.schemaname NOT IN ('pg_catalog', 'information_schema') AND number_of_scans < 1
ORDER BY 8 DESC;
Index Size to Table Size Ratio
Why? High level perspective indicating an issue with an index and/or data model.
SELECT *,
       Pg_size_pretty(total_bytes) AS total,
       Pg_size_pretty(index_bytes) AS INDEX,
       Pg_size_pretty(toast_bytes) AS toast,
       Pg_size_pretty(table_bytes) AS TABLE,
       TRUNC(total_bytes / (total_bytes - index_bytes - Coalesce(toast_bytes, 0))::numeric,2)
FROM   (SELECT *,
               total_bytes - index_bytes - Coalesce(toast_bytes, 0) AS
               table_bytes
        FROM   (SELECT c.oid,
                       nspname                               AS table_schema,
                       relname                               AS TABLE_NAME,
                       c.reltuples                           AS row_estimate,
                       Pg_total_relation_size(c.oid)         AS total_bytes,
                       Pg_indexes_size(c.oid)                AS index_bytes,
                       Pg_total_relation_size(reltoastrelid) AS toast_bytes
                FROM   pg_class c
                       LEFT JOIN pg_namespace n
                              ON n.oid = c.relnamespace
                WHERE  relkind = 'r') a
        WHERE  table_schema != 'pg_catalog' AND table_schema != 'information_schema' AND (total_bytes - index_bytes - Coalesce(toast_bytes, 0)) > 0.01
        ORDER  BY total_bytes / (total_bytes - index_bytes - Coalesce(toast_bytes, 0))::FLOAT DESC) a;
PostgreSQL Troubleshooting
Database Issue...All hands on deck. No time to waste. Check out (or bookmark) this quick to-the-point reference for troubleshooting a PostgreSQL database.
November 1, 2020
PostgreSQL Troubleshooting
November 1, 2020
Quick reference for troubleshooting PostgreSQL Database.
- Leverage A Query analyzer, e.g. Pgbadger, or alternative tool that shows poorest performing queries
- Other tools could be datadog apm, new relic, aws performance insights (not available on older db versions)
- Basic metrics to review
- CPU
- Memory
- FreeableMemory
- Disk Size
- DiskQueueDepth
- BurstBalance (aws rds specific)
- IOPs metrics
- By increasing disk (based on type), it can increase iops.
- This is helpful if you don’t want to pay for a larger instance type
- Review any changes done to app (or changes to database code) that could have caused the issue
- Review auto vacuum and auto analyze / dead vs live tuples stats
- select * from pg_stat_user_tables;
- A great debugging reference
- View long running queries
- Table missing index
- Stop db process
- Find out what is blocking a lock
- For any queries identify as poor performing, leverage EXPLAIN
Once issue has been resolved, HIGHLY consider fine-tuning database, cleaning bloat, and removing unused indices.